Visualizing LLMs response uncertainty
Check this cool demo I created using Google Colab to visualize LLMs response uncertainty.
(You can’t use this with patient’s data)
There are two central issues related to the use of LLMs, especially for healthcare applications:
- How confident is the model in its response?
- How trustworthy is the model’s response?
Many of you have been asking me questions related to these topics, so I will start by sharing some information here, which we will also cover during the AI Office hours.
There are several methods to quantify LLMs’ confidence, but let’s start with the basics.
The task of the LLM is to iteratively predict the next token given a set of previous tokens, that is, it appends the last generated token to the next input to keep generating text. For each prediction, the model chooses the most probable token (this can be modified by changing a parameter called temperature, which we will discuss in another email) out of a probability distribution. When we prompt these models via the API, some of them can return the probability of each token. For example, when I prompt GPT-4 with “The capital of France is”, it returns “Paris” with a probability score of 0.99995034. Or when I prompt the model with “Complete the following sentence with just one word that has to be food. The best food is”, the model returns “pizza” with a probability score of 0.73402217. So, we can infer that the model is “more confident” in returning Paris as the capital of France than in returning pizza as the best food, which makes sense (maybe not for the Italians on this mailing list…).
If we prompt the model to generate a longer response with multiple tokens, we can calculate the average of the probability scores across all tokens, which would be an index of the model’s overall uncertainty (or confidence if you invert the metric). This metric is called perplexity.
The Google Colab notebook color-codes each generated token based on its probability and prints the overall response perplexity. In this example, darker red means higher probability scores and more white means lower probability scores, highlighting the tokens with more uncertainty. Finally, it prints the overall perplexity, where lower scores mean lower uncertainty, or higher confidence (details of the math behind these calculations are in the notebook).
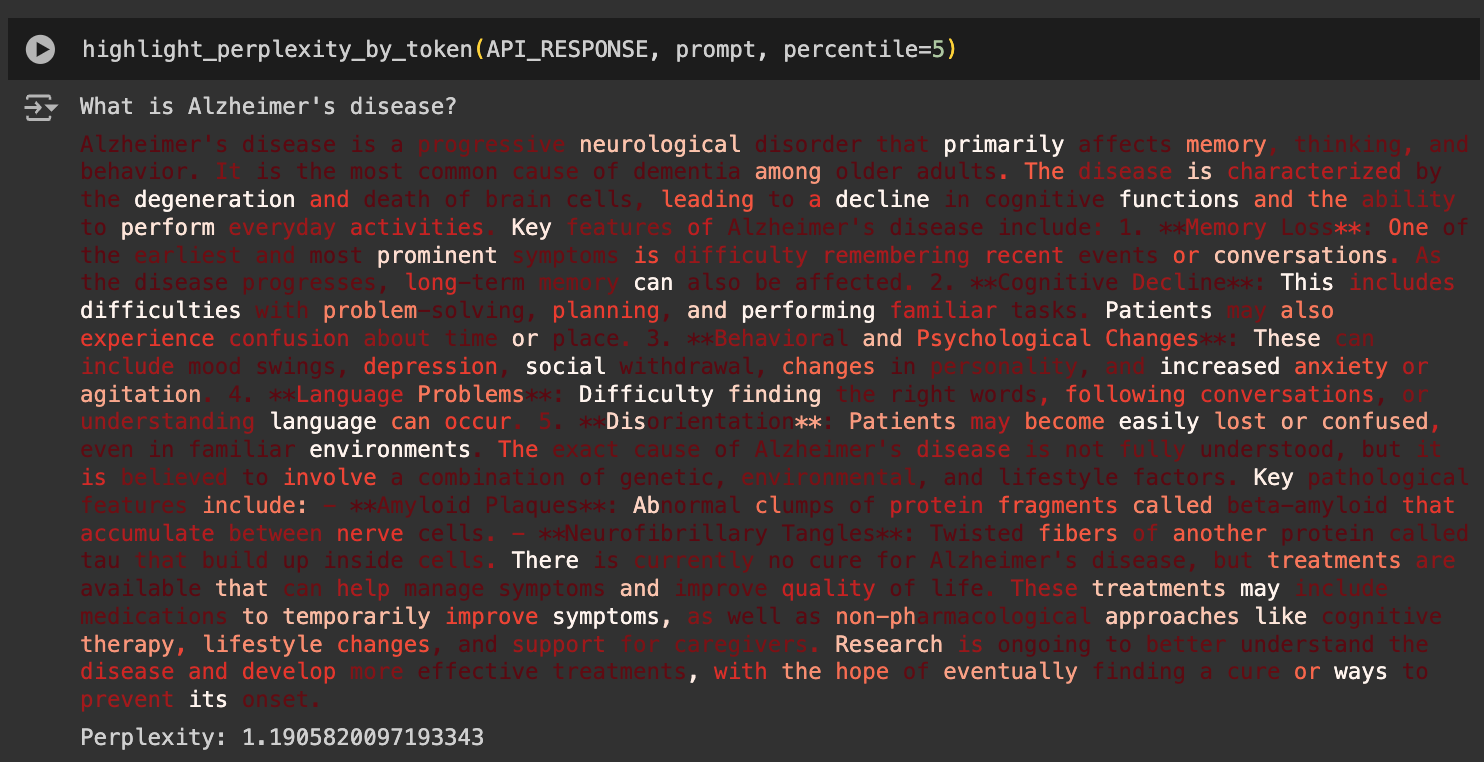
So, the model was more confident about the word “disease” than the word “primarily.” This is expected, but not very meaningful, because the word “disease” almost always follows “Alzheimer’s,” whereas “primarily” does not always come after “that.”
To make this a bit more interesting, we can calculate the local perplexity for each sentence, excluding articles and connectives from the calculation, to focus more on the conceptual words. Now, we can color-code the sentences based on their perplexity scores. Again, darker red means less uncertainty (lower perplexity) or higher confidence, and more white indicates higher perplexity/uncertainty or lower confidence.
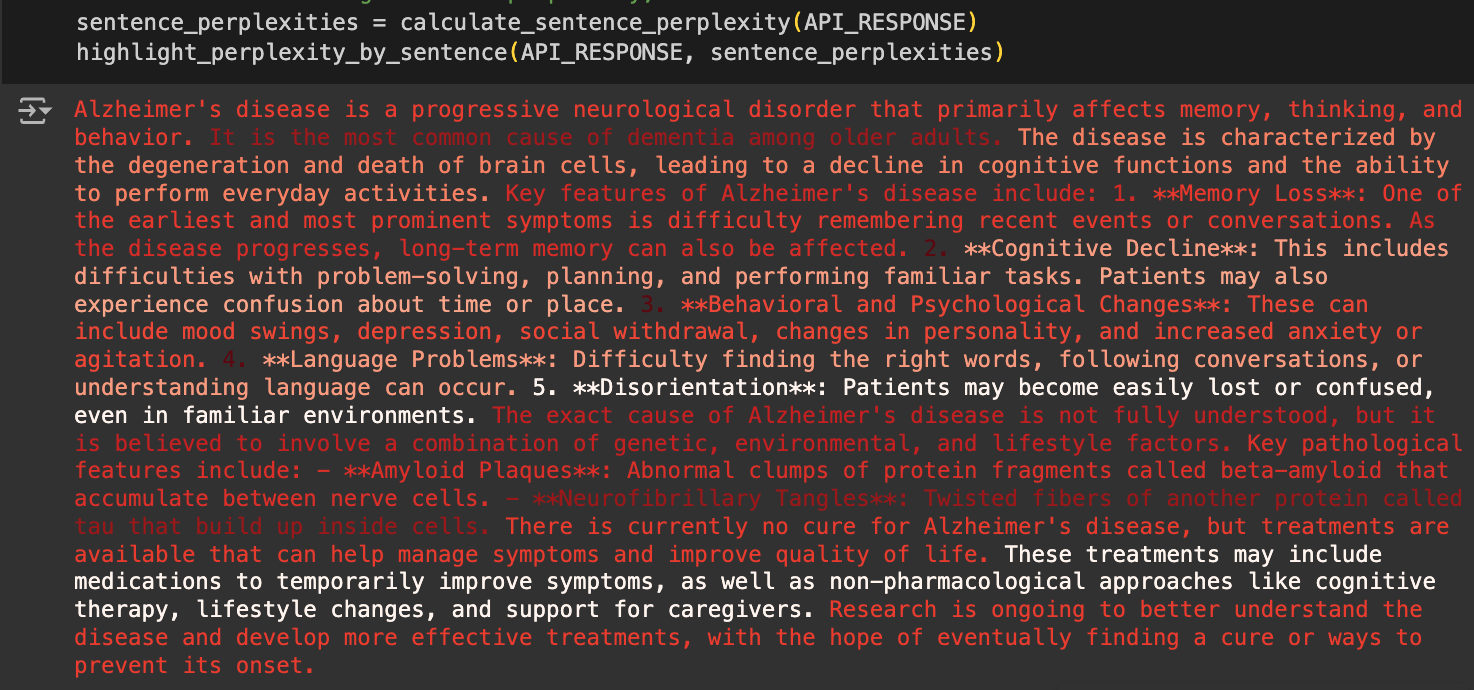
So, the model was less confident when discussing disorientation and treatments compared to Alzheimer’s being the most common cause of dementia or the fact that the cause of Alzheimer’s is not fully understood, which makes sense!
Unfortunately, the AzureOpenAI models in UCSF Versa don’t return log probabilities yet (I’m in touch with the Tiger team to make this feature available). Take a look at the Google Colab notebook and play with the prompts! You will need an OpenAI API, not the UCSF Versa one. Again, you can’t use this with patient data!
There are several other methods to extract LLMs’ response confidence, which we will explore in the near future. I hope this demo helps you better understand the inner workings of LLMs and sharpen your critical interpretation and reliance on these models.
References:
OpenAI - use logprobs - This notebook demonstrates the use of the logprobs parameter in the Chat Completions API.